Executive Summary
For the third-annual VTS Leasing Prediction Outlook, we have analyzed our AI-powered office demand data, the industry's earliest leading indicator of office leasing, to forecast 2026 leasing trends across three of the world's most influential markets: New York, San Francisco, and London. These three markets exude an outsized amount of global influence in CRE due to their level of capital as well as talent, and have come up repeatedly in institutional circles as key bellwethers for the broader office recovery.
Office leasing activity exceeded our forecasts in 2025 across all three markets we track. San Francisco, New York, and London each outperformed our projections, though by varying degrees. This report presents our 2026 outlook for each market, reviews our 2025 forecast accuracy, and explains where and why we were conservative last year.
With VTS Data powered by VTS AI, we bring predictive market intelligence directly to our customers. This enables landlords, brokers, and investors to understand leasing trends at least 6-12 months before they are recorded in traditional market statistics. As a result, we can make credible forecasts around the trajectory of leasing and net absorption, and hold ourselves accountable to those predictions.
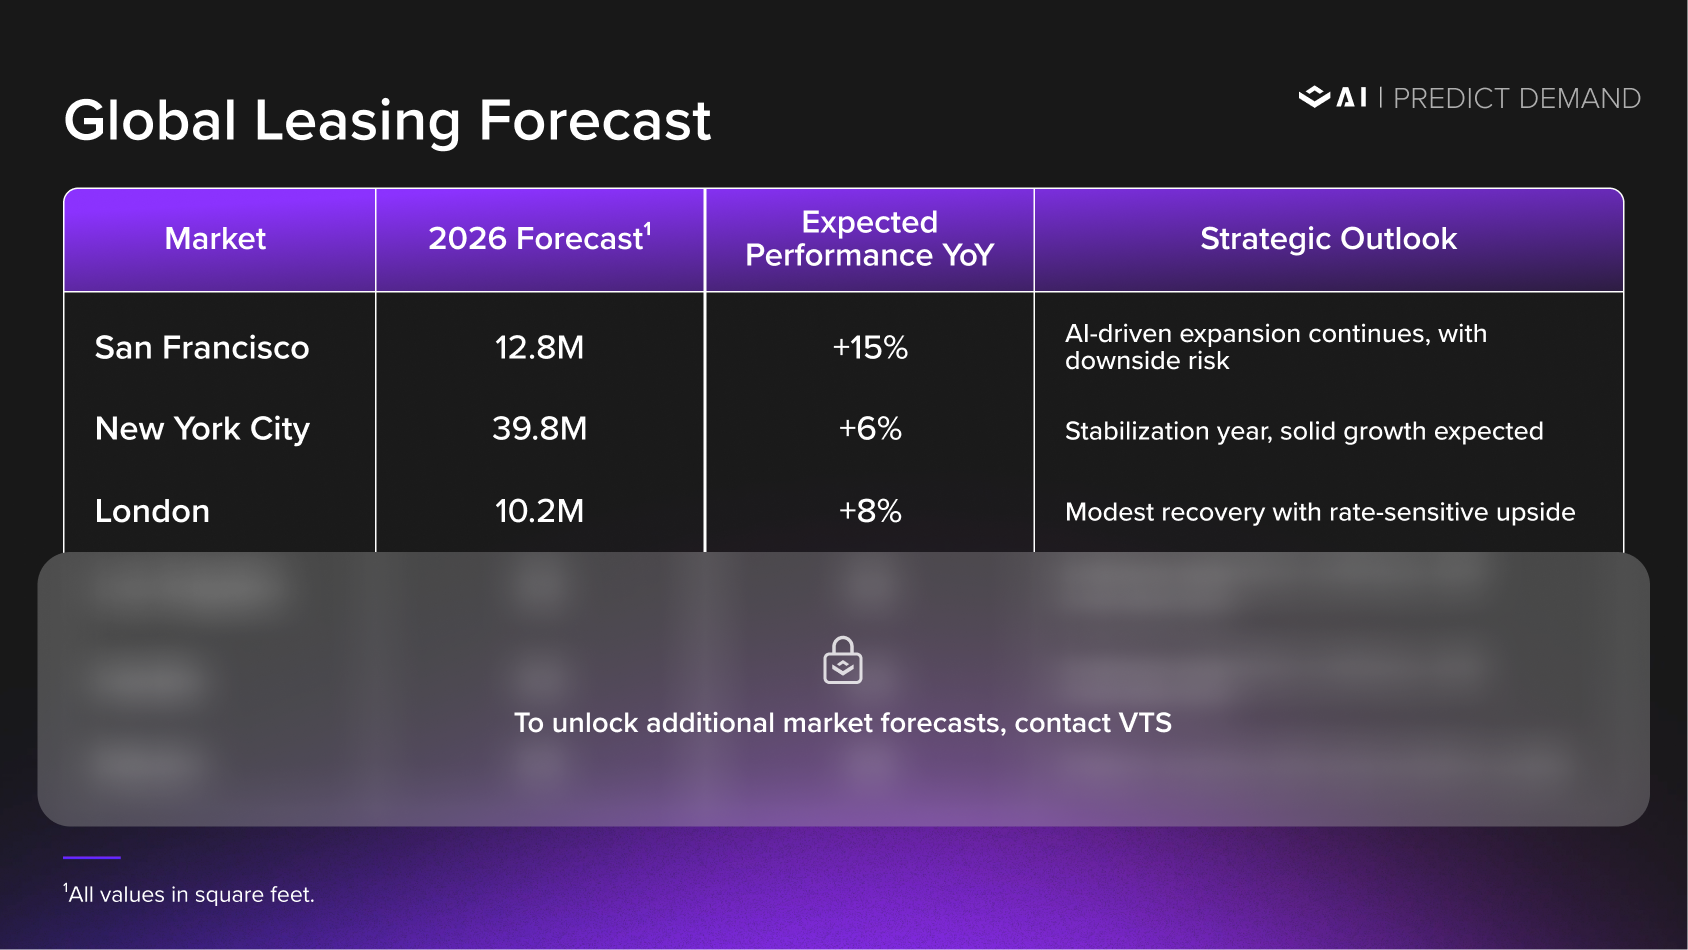
2026 Global Leasing Forecast
2026 Market Deep Dives
San Francisco
VTS forecasts San Francisco's 2026 leasing activity to be approximately 12.8M square feet, representing year-over-year growth of 15%. We have applied a discount to our model outputs to reflect concentration risk in AI-sector demand.
However, we recognize the risks to this view. Commentary around an AI investment bubble has intensified, and the sector's leasing activity is highly concentrated among a small number of well-funded companies. A pullback in AI funding, a shift toward capital efficiency, or delays in enterprise AI adoption could materially reduce demand. San Francisco's trajectory remains more dependent on a single sector than New York or London, which makes it more vulnerable to a correction.
That said, the current pipeline of active requirements remains robust, and the companies driving demand have substantial capital reserves. Data from our base case reflects a normalization from 2025's exceptional growth. Our downside scenario accounts for potential AI sentiment shifts, while our upside case assumes continued momentum from the broader AI ecosystem.
Recent activity supports this view. In January 2026, Anthropic signed a 420,000 SF lease at 300 Howard Street, one of the largest single-tenant deals in Downtown San Francisco since the pandemic, bringing its total footprint to over 750,000 SF across three buildings.
New York City
After two consecutive years of exceptional growth, New York enters 2026 with an elevated baseline. We forecast 39.8M square feet of leasing, representing approximately 6% year-over-year growth.
Our downside scenario assumes a mean-reversion dynamic where some of 2025's activity represented pull-forward demand. We view this as less likely given the strength of current pipeline activity. Data from our base case expects continued strength driven by financial services modernization, flight-to-quality dynamics, and sustained return-to-office momentum. Our upside scenario is only marginally higher, suggesting greater confidence in the upper end of the range.
London
London is poised for modest recovery in 2026, with our forecast of 10.2M square feet, representing approximately 8% year-over-year growth. After consecutive years of decline, early demand indicators suggest stabilization. Our scenario range is relatively tight, reflecting high model agreement and lower forecast uncertainty compared to other markets. Class A demand remains strong, with prime West End and City rents at record levels, though overall take-up will depend on broader economic conditions and the pace of large transactions converting from pipeline to executed leases.
Reviewing Our 2025 Predictions
Precision matters in forecasting. In the interest of transparency regarding our predictions and their outcomes, we were too conservative across the board in 2025, but we got the directions and relative rankings right. We were bullish on New York, highly bullish on San Francisco, and appropriately cautious on London. In each case, more demand materialized and converted to executed leases than we could have reasonably predicted at the start of the year, each for different reasons and under varying circumstances. Although our beginning of the year prediction was slightly conservative for the three markets captured, our mid-year forecast was much closer to end-of-year totals. The ability for VTS AI to predict demand on average 6-12 months in advance of leasing activity ensures that accuracy improves as the year progresses.
Understanding the Variances
San Francisco Exceeded Even Our Bullish Expectations
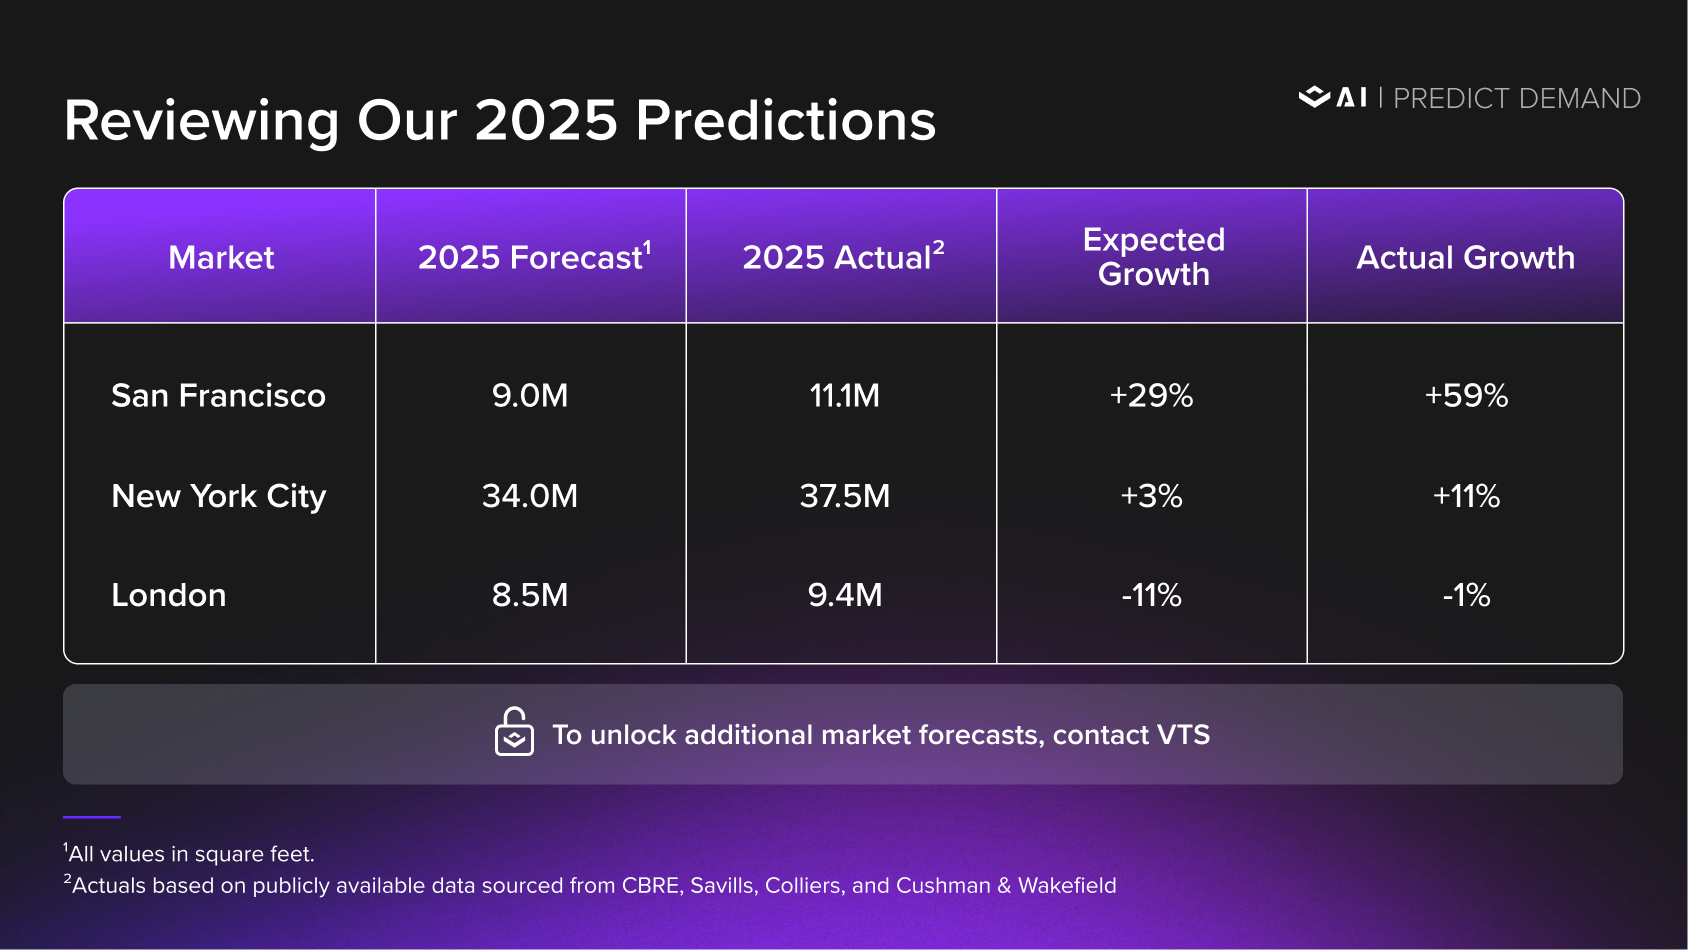
We named San Francisco our "Growth Pick" for 2025 and forecasted 29% year-over-year growth, a bold call at the time. The market delivered 59% growth, more than doubling our expected expansion rate. Our 9M square foot forecast proved conservative as San Francisco delivered 11.1M square feet. While we correctly identified San Francisco as the standout performer and predicted substantial recovery, the unprecedented boom of the AI sector outpaced even our bullish projections. OpenAI now occupies nearly 1 million square feet across Mission Bay. Anthropic added 100,000 square feet at 505 Howard Street. Sierra, founded by former Salesforce co-CEO Bret Taylor, signed a 300,000 square foot lease at 185 Berry Street. This hyper-concentration of AI investment created demand velocity that exceeded historical patterns.
New York City Had a Great Year, As Predicted
We said New York would have a great year in 2025, and it delivered. The market posted 37.5M square feet against our forecast of 34M, a variance of approximately 9%. The modest underestimate reflects stronger-than-anticipated leasing from major financial institutions. JPMorgan expanded to nearly 500,000 square feet at 390 Madison Avenue even after opening its new headquarters. Citadel committed to 850,000 square feet at 350 Park Avenue. Jane Street expanded to nearly one million square feet at 250 Vesey Street. Millennium Management signed for 438,000 square feet at 399 Park Avenue. These large commitments, combined with record activity at rents above $100 per square foot, drove the market beyond our projections.
London Had Correct Direction, Yet Conservative Magnitude
London delivered 9.4M square feet against our forecast of 8.5M SF, a variance of 11%. Importantly, we were correct in predicting that London would be the only market to experience a year-over-year decline, with leasing activity down 1.3% from 2024. Our conservative stance on the absolute number reflected concerns about the demand pipeline at the time of forecasting, though the market proved more resilient than we anticipated.
A Note on Model Timing
Our mid-year outlook, reforecasted with updated demand signals, was considerably closer to final outcomes in each market. The real-time nature of VTS Data means predictive accuracy improves as the year progresses and more demand converts to pipeline activity.
Looking Ahead
As we enter 2026, each market presents a distinct profile. San Francisco's AI-driven recovery carries meaningful upside but also concentration risk. New York offers stability at high volumes. London is stabilizing after consecutive years of decline. We remain committed to providing the leading data-driven insights that help investors, owners, and brokers navigate these dynamics.
The forecasts presented in this outlook represent our base case expectations. We also maintain low and high scenario forecasts for each market that account for downside risks and upside potential. To access our full forecast range, including detailed low, base, and high case scenarios, please contact the VTS Research team.
For deeper analysis of these markets or forecasts for additional cities, schedule a demonstration of VTS AI's in-app predictive market intelligence.